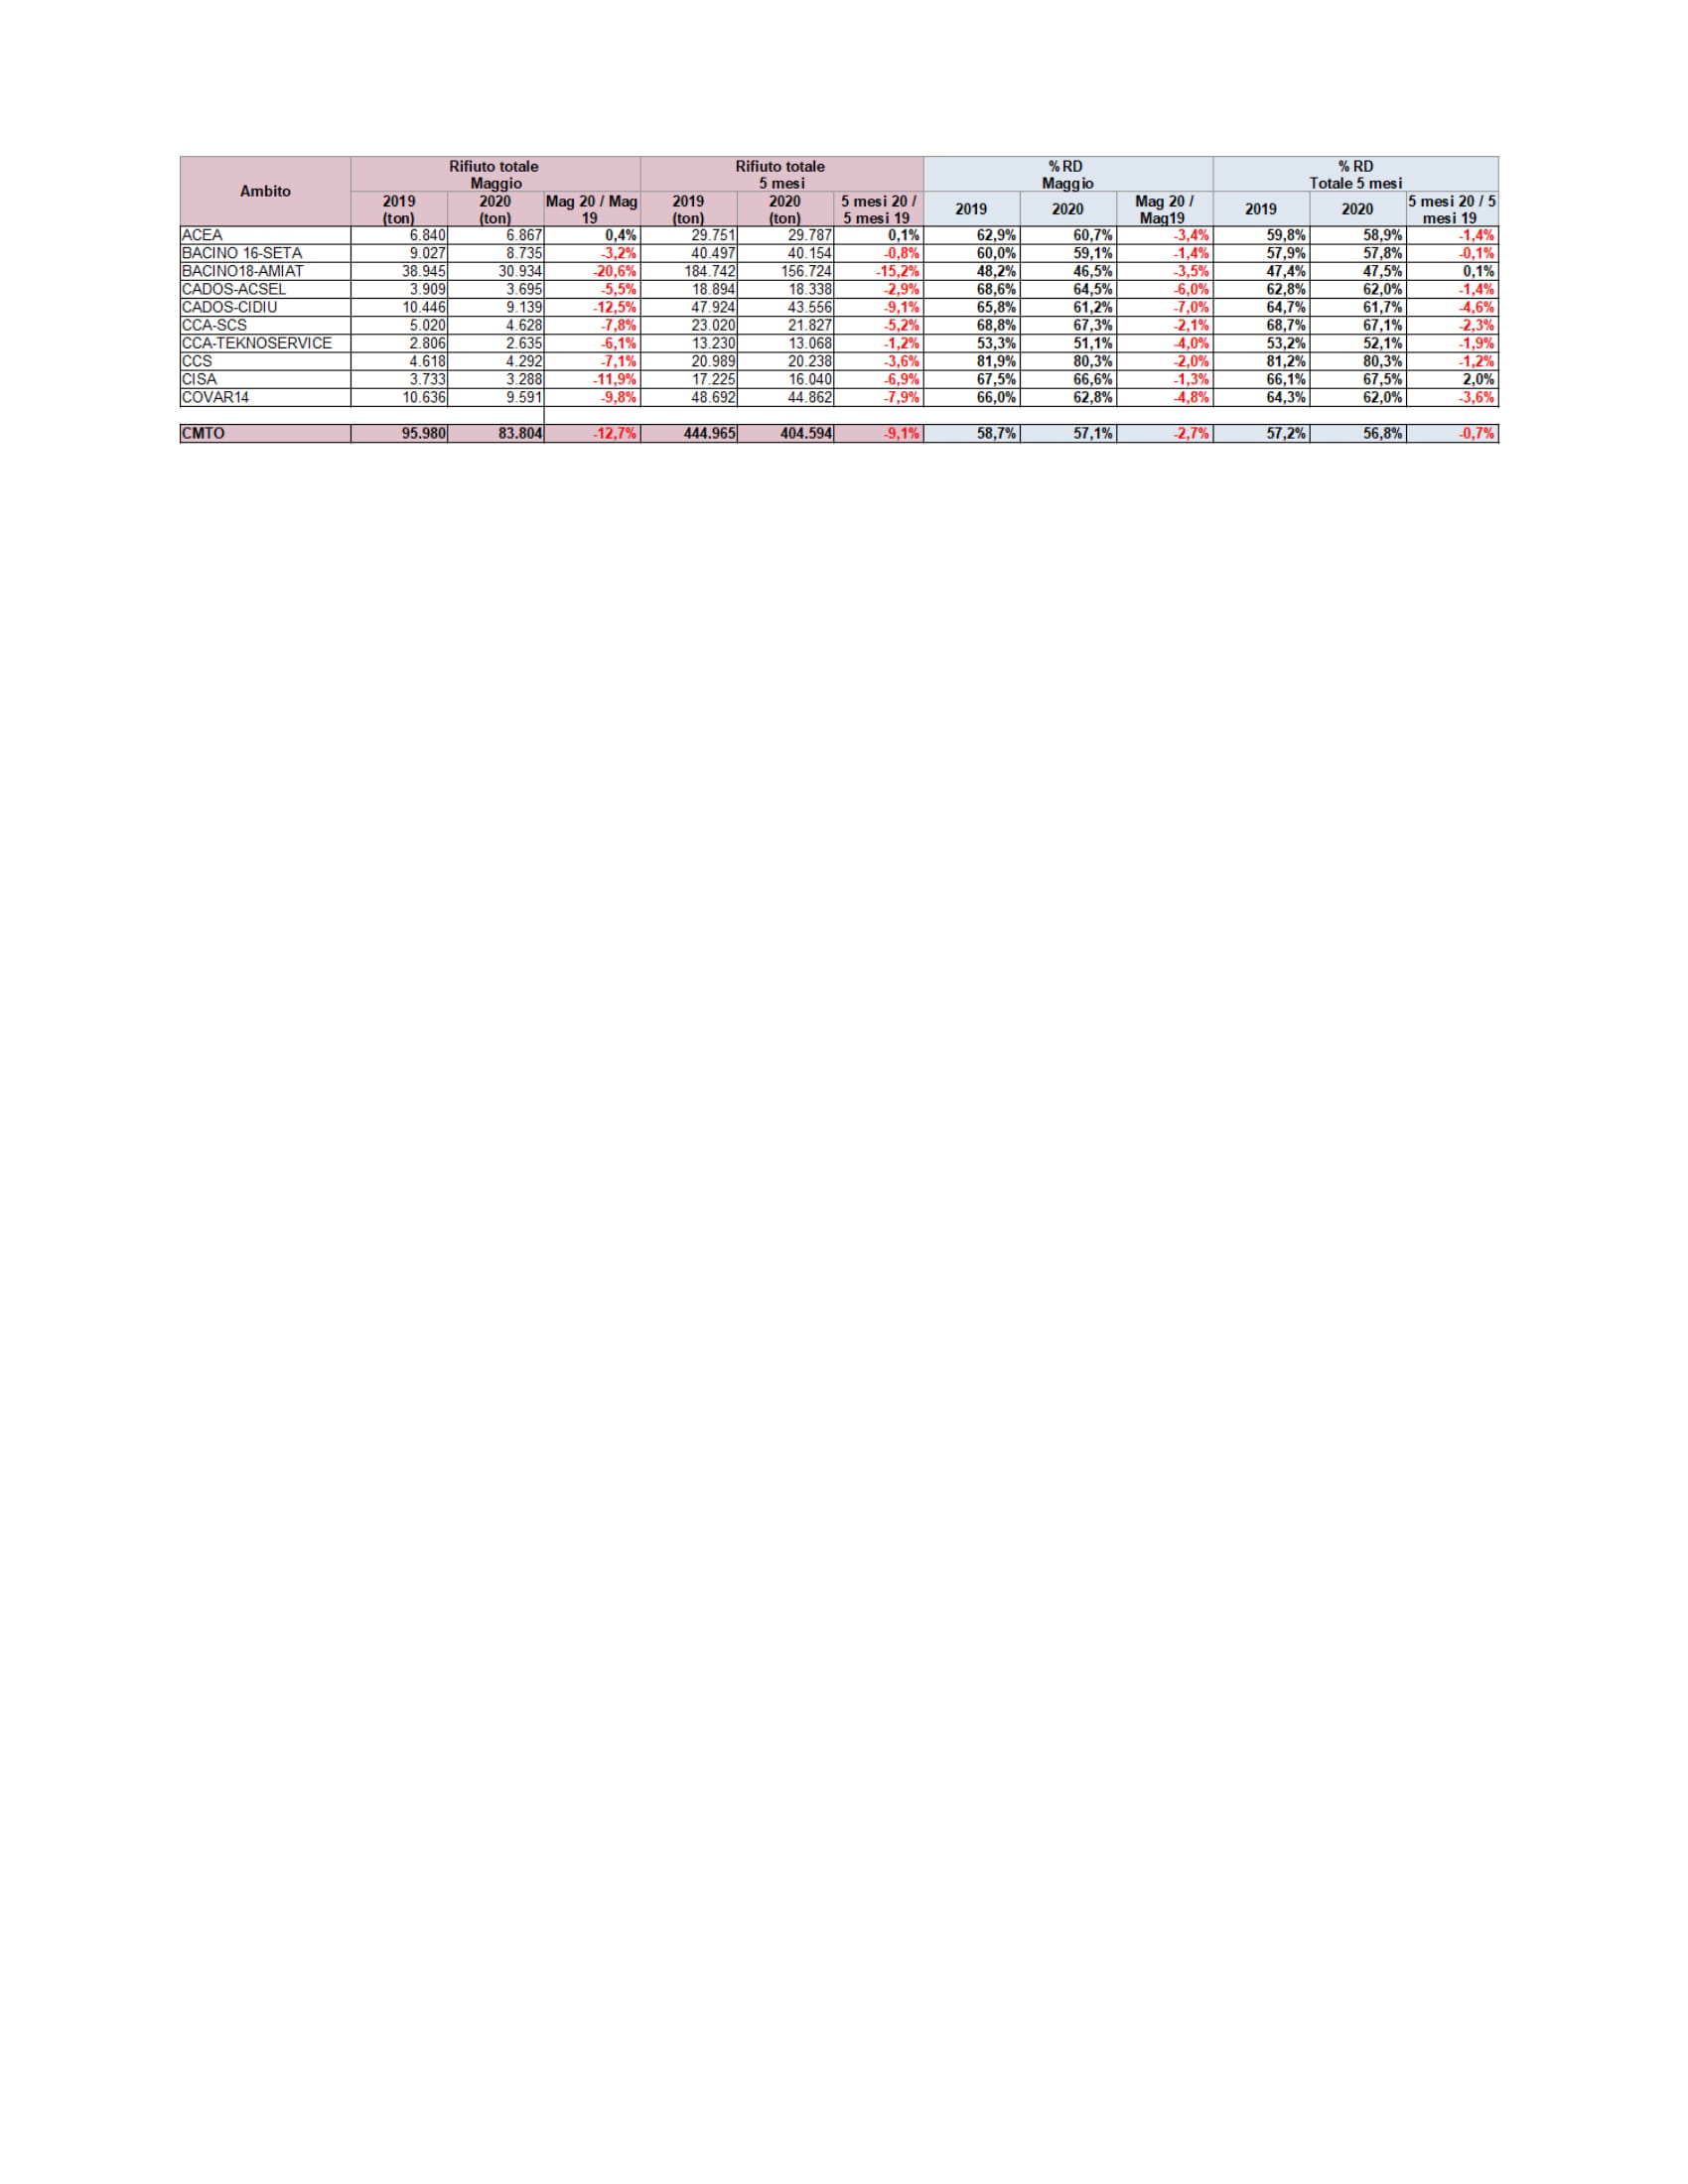
Total waste production
Total waste production in May 2020 is still lower than that of the same month last year, but recovering from the negative peak in April. In all areas of the Metropolitan City of Turin, while the balance sheet continues to be negative compared to May 2019, the reduction is decidedly less marked than in April. The Pinerolo basin (ACEA) in which waste production (which recorded -9.5% in April 2020 compared to the same month of 2019) in May returned to be absolutely in line with the same month of last year. The City of Turin still shows a significant reduction (-20.6%), but in an appreciable improvement compared to the previous month, which instead recorded a -26.8%. In addition to the capital, double-digit reductions are recorded, although much less important than Turin city, the area served by CIDIU and that served by CISA.
Recycling
With the sole exception of the City of Turin, and to a very limited extent of COVAR14, separate waste collection also increased in May compared to the April comparison (2020/2019); in fact, while continuing to register lower percentage values in the month of May 2020 compared to the same month in 2019, the distance has been significantly reduced.
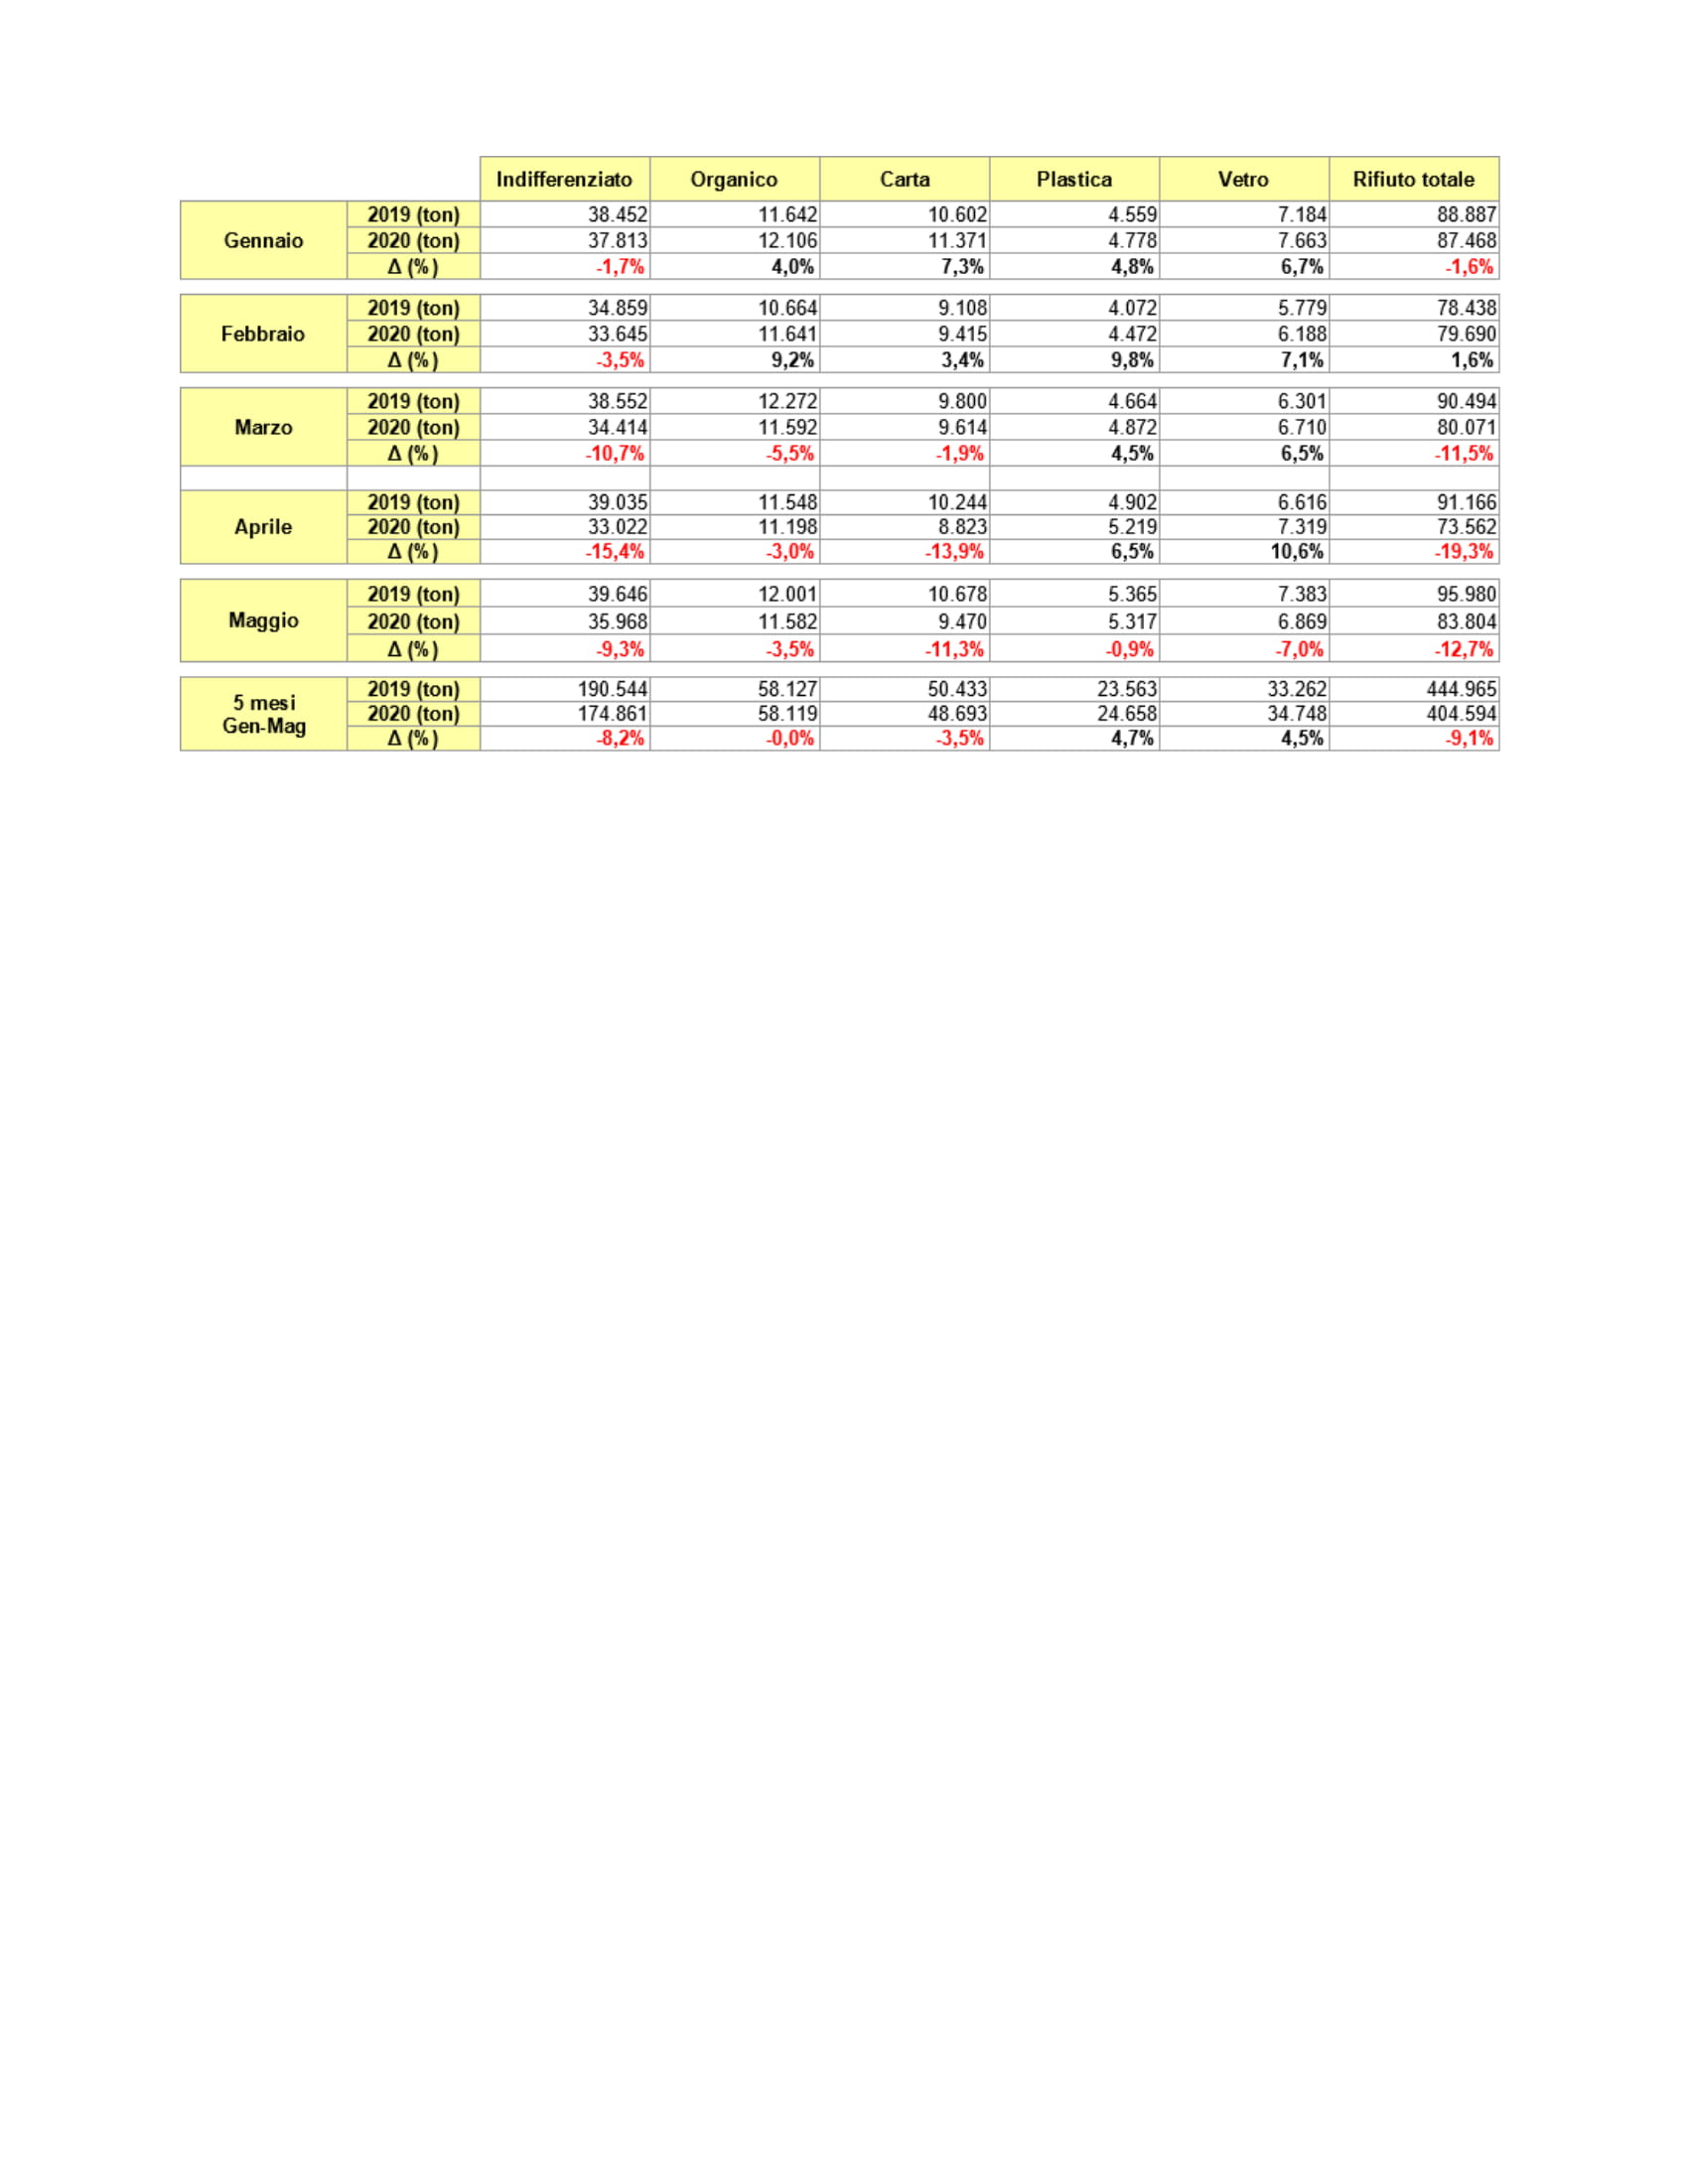
 Interception of main waste fractions
The month of May 2020 is particularly interesting for the interception of the main differentiated fractions. For the first time in the first five months of the year, plastic and glass show a reduction, even substantial glass (-7%), although the month of May was that of the reopening of restaurant premises. The reduction in the production of plastic packaging waste can be explained by the stable reopening of the local markets (which above all in Turin have a large catchment area) and therefore by a greater consumption of loose fruit and vegetables.The production of paper / cardboard, although continuing to be negative (-11.3%), shows a slight increase compared to the month of April.
To enlarge the tables click on the image.
The monthly production data, by municipality and by territorial area, published by the Metropolitan Waste Observatory, can be consulted at the following link